Dashboard
The Dashboard pulls your most important numbers into one view — so a 60-second scan each morning tells you whether your business is on track.
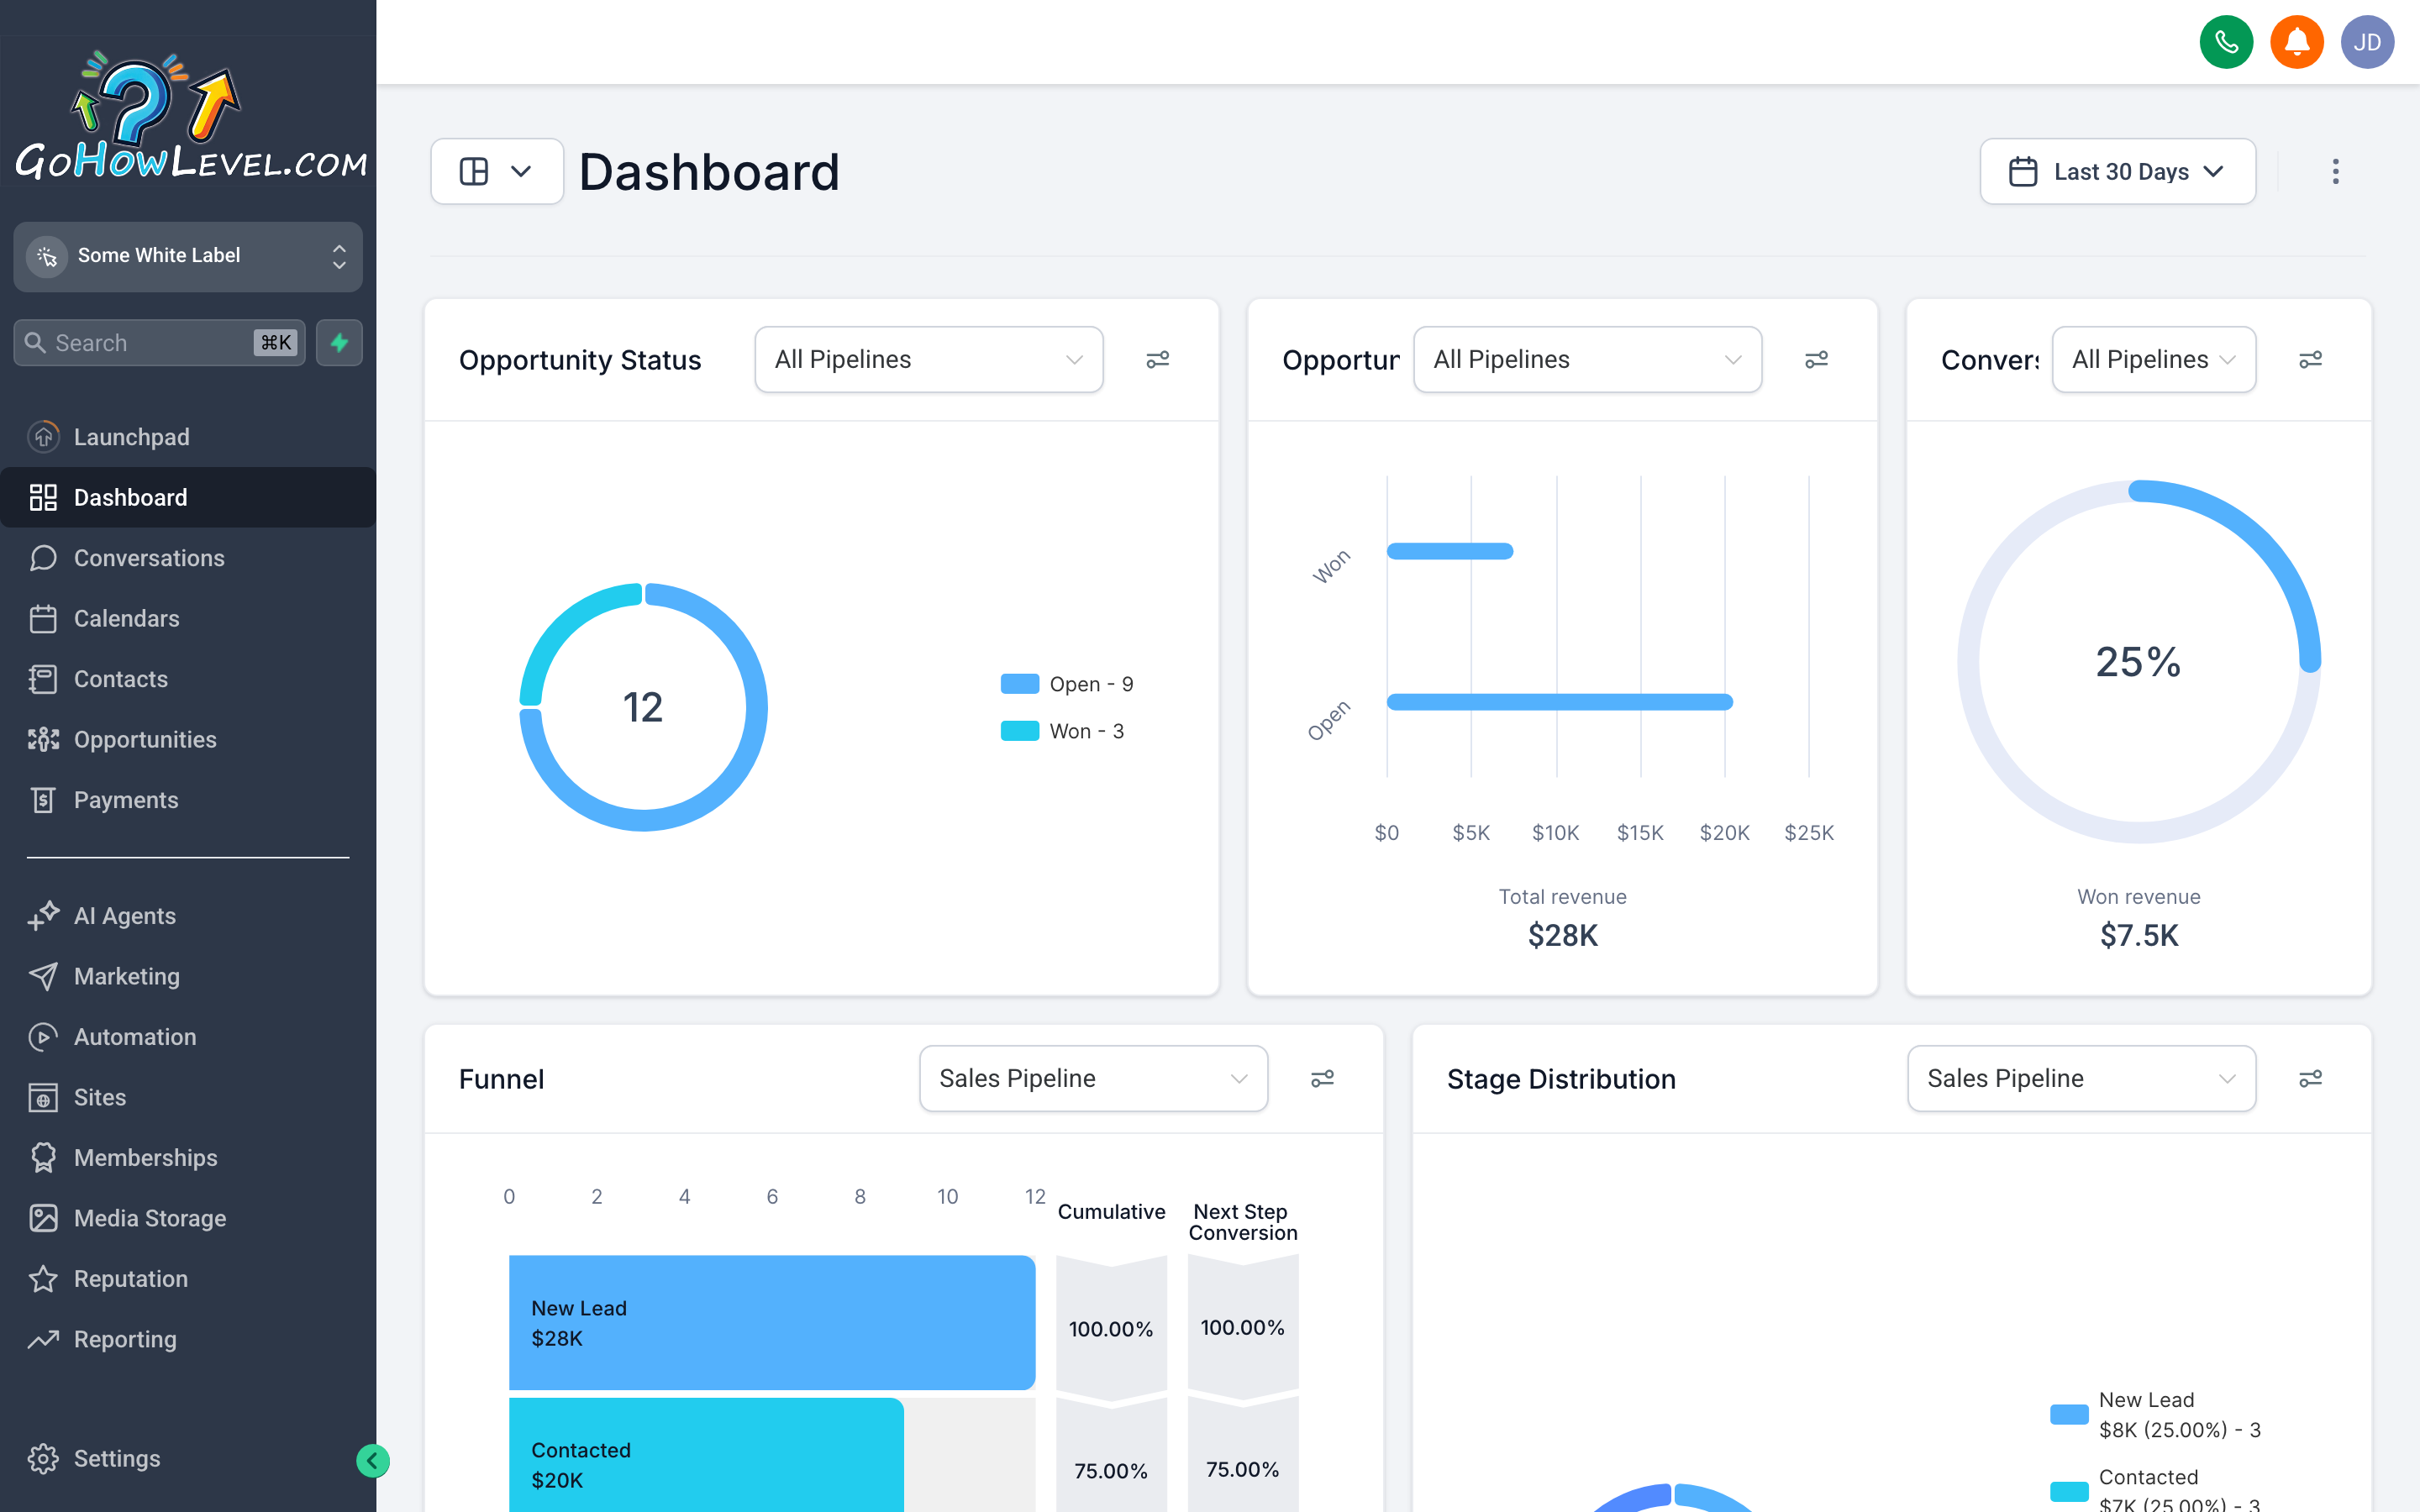
Your Dashboard is the first thing you see when you log in, and for good reason: it answers the questions you actually care about. How much revenue is in my pipeline? Are leads converting? Where are they coming from? What do I need to do today? As you use your CRM — adding contacts, moving deals through stages, closing opportunities — every widget on the Dashboard updates automatically. There’s nothing to configure upfront; the data flows in as you work.
Understanding the key widgets
Section titled “Understanding the key widgets”Pipeline Value
Section titled “Pipeline Value”This number shows the total estimated revenue sitting in your active opportunities right now. It’s a sum of the dollar amounts attached to every open deal in your pipeline. If that number looks low, it’s a prompt to either add more opportunities or check whether deals are getting stalled in early stages.
Stage Distribution
Section titled “Stage Distribution”A visual breakdown of how many deals are in each stage of your sales pipeline — Inquiry, Proposal Sent, Negotiation, and so on. Use this to spot bottlenecks: if you see a big pile in one stage, that’s where deals are getting stuck and where you should focus your follow-up.
Conversion Rate
Section titled “Conversion Rate”The percentage of leads that move all the way to a closed/won outcome. Your conversion rate is one of the most honest signals of how well your process is working. A high close rate with low pipeline value means you need more leads coming in. A healthy pipeline with a low close rate means your follow-up or offer needs attention.
Lead Sources
Section titled “Lead Sources”A breakdown of where your contacts are arriving from — web forms, manual entry, integrations, referrals, campaigns, and so on. Pay attention to this widget when you’re running multiple marketing channels; it shows you which sources are actually producing leads so you can double down on what’s working.
A count of your open to-dos. The Tasks widget is a quick gut-check: if the number is climbing day over day, you’re falling behind on follow-ups and actions. Click the widget to see the full list and start knocking them out.
Recent Activity
Section titled “Recent Activity”A running feed of what’s happened recently — new contacts added, deals moved, messages sent, appointments booked. It’s not a widget you need to analyze, but it’s useful for quickly catching up after time away or for auditing what your team has been doing.
How data populates the Dashboard
Section titled “How data populates the Dashboard”The Dashboard pulls live data from the records in your CRM — no manual reporting or syncing required. Here’s what drives each section:
- Pipeline Value and Stage Distribution come from your open opportunities and the dollar amounts you assign to each.
- Conversion Rate is calculated from opportunities that have been marked won or lost.
- Lead Sources pull from the source field on each contact, which gets set automatically when a contact comes in through a form or integration, or manually when you add one by hand.
- Tasks reflect any tasks assigned to you (or your whole account, depending on your role).
The more consistently you log outcomes — moving deals to won/lost, tagging lead sources, completing tasks — the more accurate and useful your Dashboard becomes.
Changing the date range and filters
Section titled “Changing the date range and filters”By default, the Dashboard shows data for the current month. To change the window:
- Look for the Date Range selector near the top-right of the screen.
- Click it to open the date picker.
- Choose a preset — Today, This Week, This Month, This Quarter — or set a custom range.
- All widgets update immediately to reflect the selected period.
Some views also let you filter by a specific Pipeline or Team Member if you manage multiple pipelines or a team. Look for those filter options alongside the date range selector.
Using the Dashboard as a daily routine
Section titled “Using the Dashboard as a daily routine”The most effective way to use the Dashboard isn’t to build reports — it’s to make a 60-second check part of your morning routine. Here’s a simple daily check-in pattern:
- Glance at Pipeline Value — is it higher or lower than yesterday? If it’s dropping, you may need to add new opportunities.
- Check the Tasks widget — click through to see what’s due or overdue. Handle the oldest ones first.
- Look at Stage Distribution — is anything piling up? That’s your follow-up priority for the day.
- Scan Recent Activity — anything unexpected? A new lead you didn’t notice? An appointment just booked?
This habit takes less than a minute and keeps you from being surprised by a thin pipeline at the end of the month.
Drilling into the numbers
Section titled “Drilling into the numbers”Most Dashboard widgets are clickable. If you see a number that catches your eye, click it:
- Clicking a pipeline stage segment takes you to a filtered list of opportunities in that stage.
- Clicking Tasks opens your full task list with filters for due date and status.
- Clicking a Lead Source segment takes you to a filtered contact list showing everyone from that source.
Use this as a shortcut — you don’t have to navigate manually to Contacts or Opportunities every time you want to investigate something the Dashboard surfaced.