Reporting
The Reporting hub pulls data from across your CRM into one place — pipeline activity, ad spend, call logs, and lead sources all visible without switching between tools.
Guessing is expensive. The Reporting section exists to replace gut feel with actual data: how many leads came in last month, where they came from, which ad campaign drove the most closed deals, how your team handled calls. Each report type focuses on a specific question, and this page explains what each one shows, how to read it, and how to act on what you find.
The Reporting hub
Section titled “The Reporting hub”
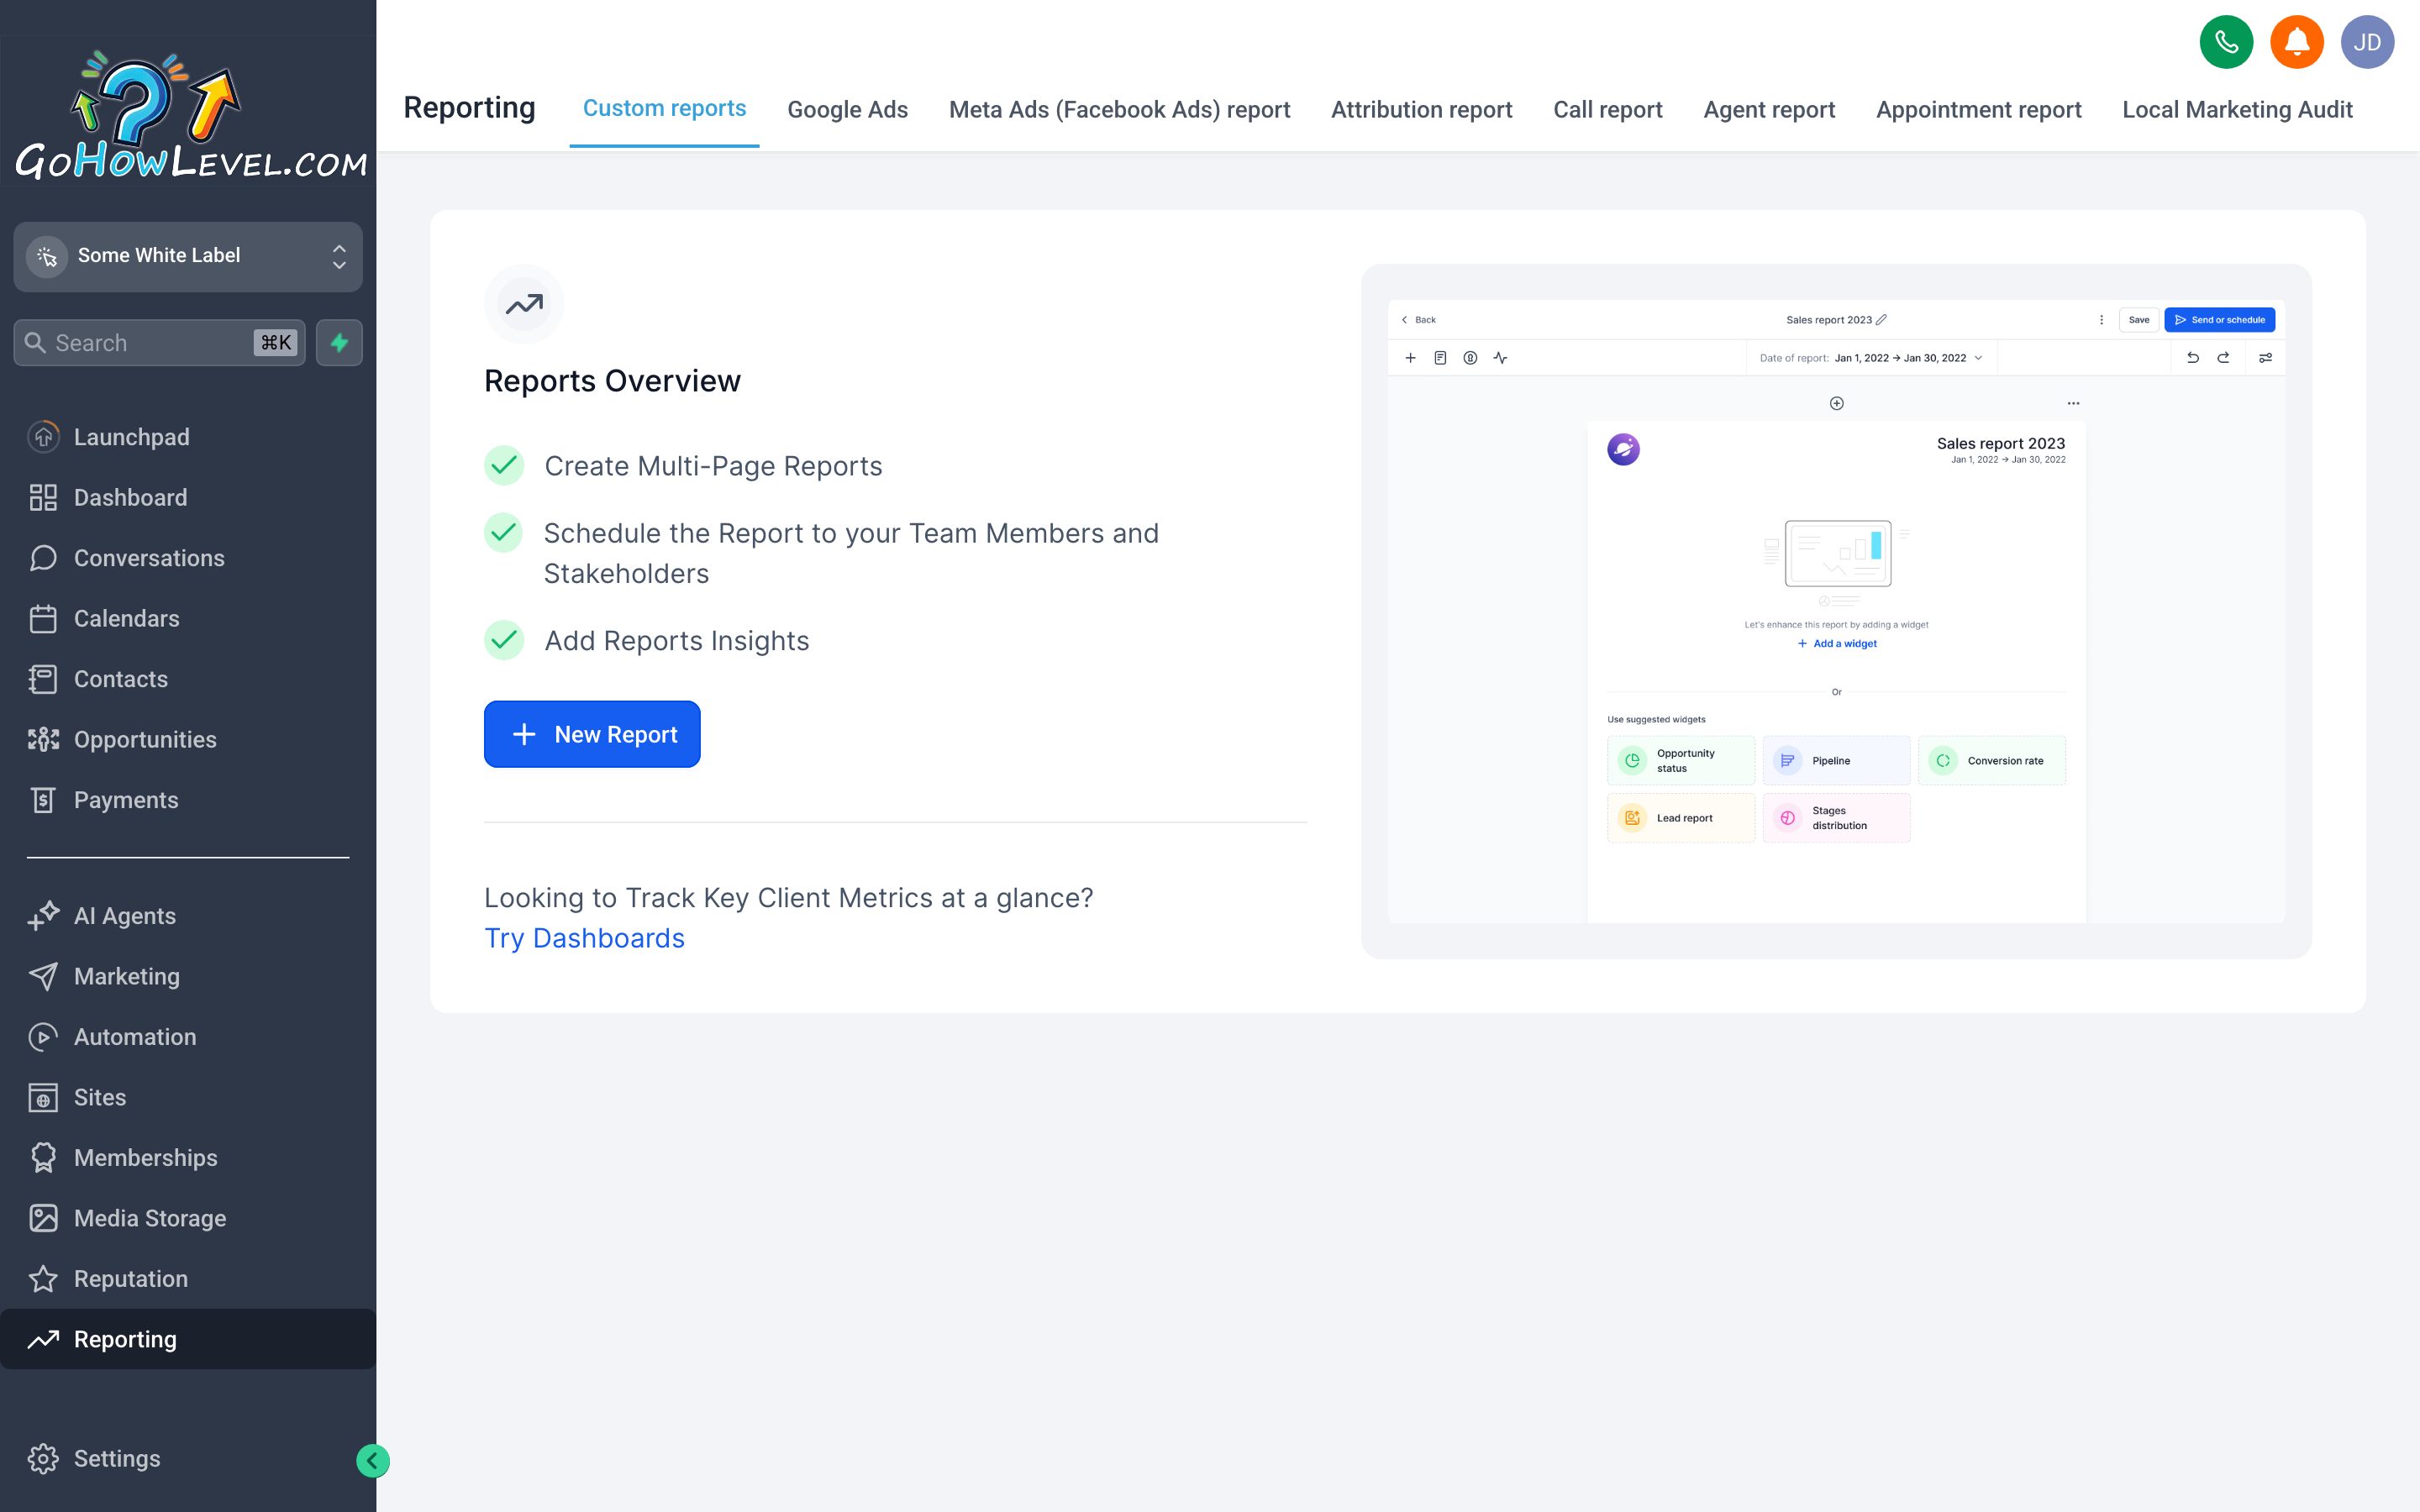
The main dashboard is the starting point — set your date range first, then dig into the specific report tabs that match what you’re trying to understand.
When you open Reporting from the left navigation, you land on the main dashboard. Before reading any numbers, set your Date Range using the picker at the top. The entire dashboard — every widget, every chart — filters to that window.
The dashboard surface-level metrics include:
- Contacts Added — new contacts created in the period.
- Appointments Booked — calendar bookings confirmed during the period.
- Pipeline Revenue — total value of deals in your pipelines (you can filter by pipeline).
- Stage Conversion Rates — what percentage of contacts move from each stage to the next.
These cards are useful for a quick weekly or monthly health check. For anything deeper, use the dedicated report tabs.
Set a custom date range
Section titled “Set a custom date range”- Click the Date Range selector at the top of any report view.
- Choose a preset (Last 7 Days, Last 30 Days, This Month, Last Quarter) or set a custom start and end date.
- The page refreshes automatically.
Google Ads Reporting
Section titled “Google Ads Reporting”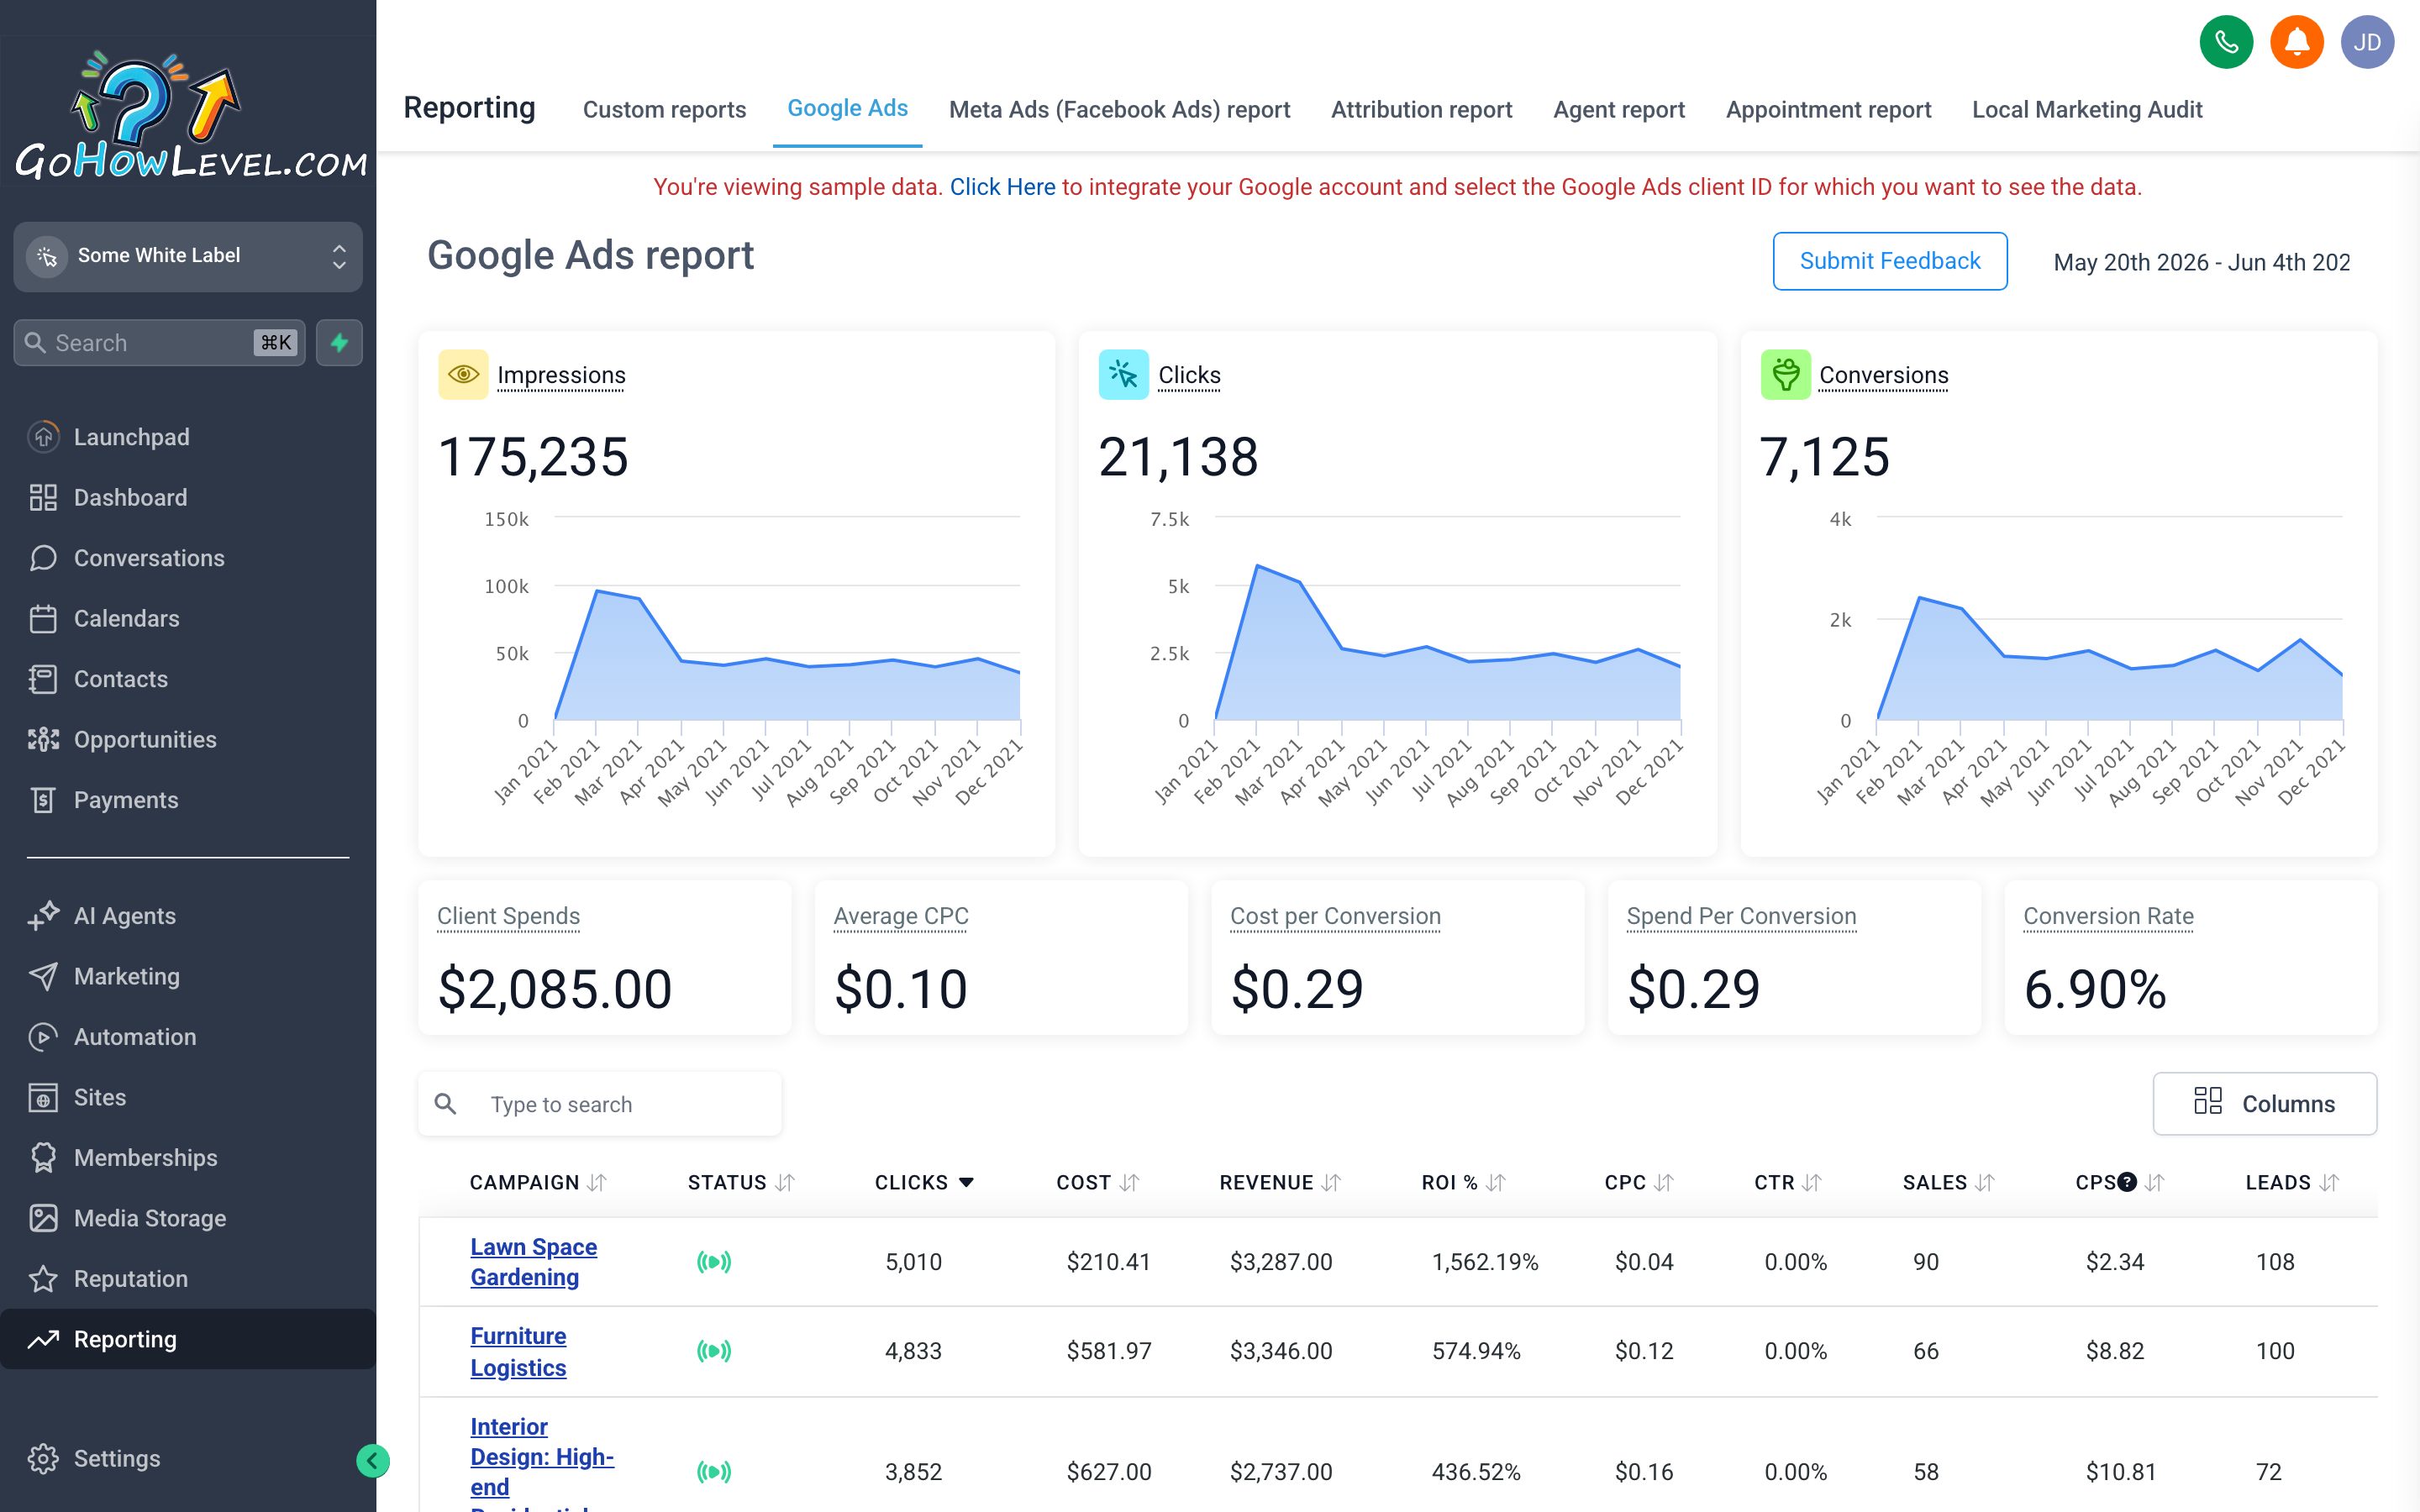
The Google Ads report brings your campaign spend and conversion data directly into your CRM — so you can see ad performance alongside the pipeline activity it created.
The Google Ads tab shows performance data from your connected Google Ads account. You can see how each campaign, ad group, and individual ad is performing — without leaving your CRM.
What the report shows
Section titled “What the report shows”- Impressions — how many times your ads were shown.
- Clicks — how many times someone clicked through to your landing page.
- Click-Through Rate (CTR) — clicks divided by impressions; a measure of ad relevance.
- Cost — total spend for the selected period.
- Cost Per Click (CPC) — average cost for each click.
- Conversions — actions your Google Ads account is tracking (form submissions, calls, purchases).
- Cost Per Conversion — total spend divided by conversions; the most important efficiency metric.
How to use it
Section titled “How to use it”- Open Reporting → Google Ads.
- Set your date range.
- Look at cost-per-conversion first. Sort campaigns by this column descending to see which ones are most expensive per result.
- Compare to the pipeline revenue those campaigns generated (cross-reference in the main dashboard filtering by source).
- Campaigns with low cost-per-conversion and meaningful pipeline contribution deserve more budget. Campaigns with high cost-per-conversion and little pipeline contribution are candidates for pause or restructure.
Meta / Facebook Ads Reporting
Section titled “Meta / Facebook Ads Reporting”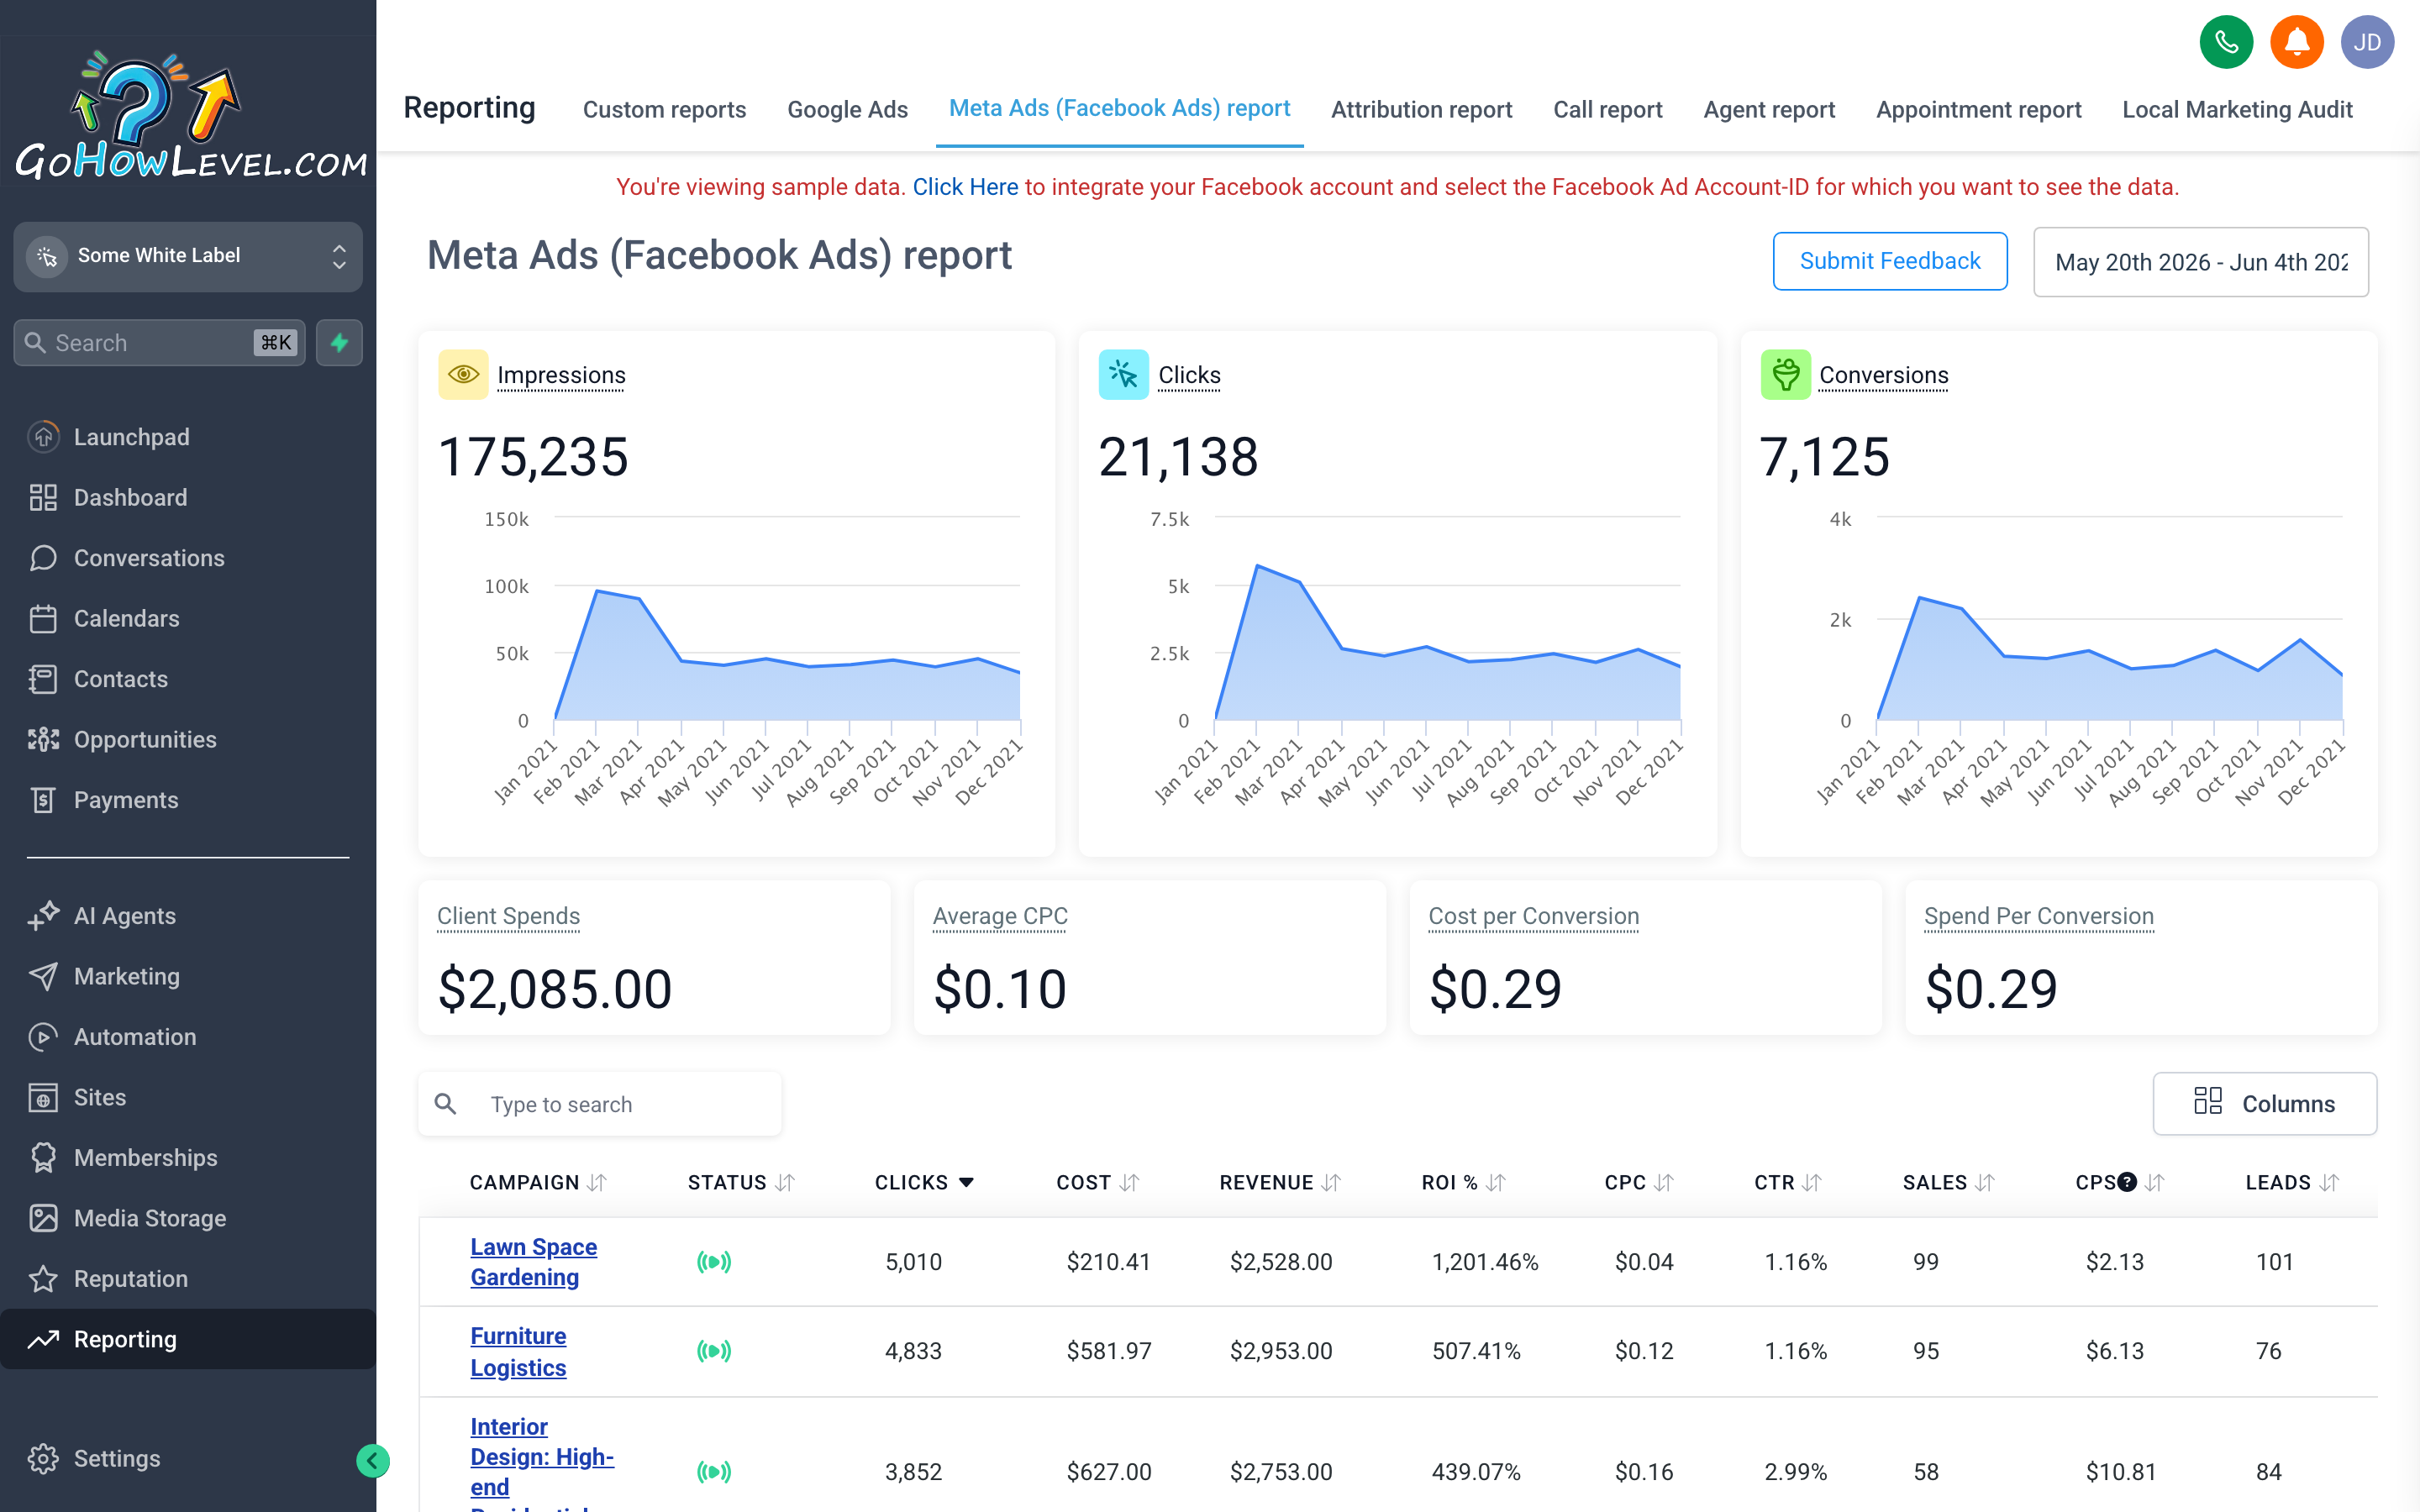
The Facebook Ads report mirrors the structure of Ads Manager but presents the data in context with your CRM activity — so you can see ad performance and lead quality together.
The Facebook Ads tab shows performance data from your connected Meta ad account. The structure mirrors Meta Ads Manager: data is grouped by campaign, then ad set, then individual ad.
What the report shows
Section titled “What the report shows”- Reach — unique people who saw your ad.
- Impressions — total times your ads were displayed (one person can generate multiple impressions).
- Link Clicks — clicks to your destination URL.
- Cost Per Link Click — spend divided by link clicks.
- Results — the conversion event you have defined (leads, purchases, etc.).
- Cost Per Result — the efficiency metric that matters most.
How to use it
Section titled “How to use it”- Open Reporting → Facebook Ads.
- Set your date range.
- Review Cost Per Result at the campaign level. High cost-per-result campaigns are worth diagnosing — check audience targeting, creative fatigue, and landing page alignment.
- Use the Ad Set drill-down to compare audience segments within the same campaign.
- Look for trends over time, not just snapshots. A campaign’s cost-per-result increasing week-over-week often signals audience saturation.
Attribution Reporting
Section titled “Attribution Reporting”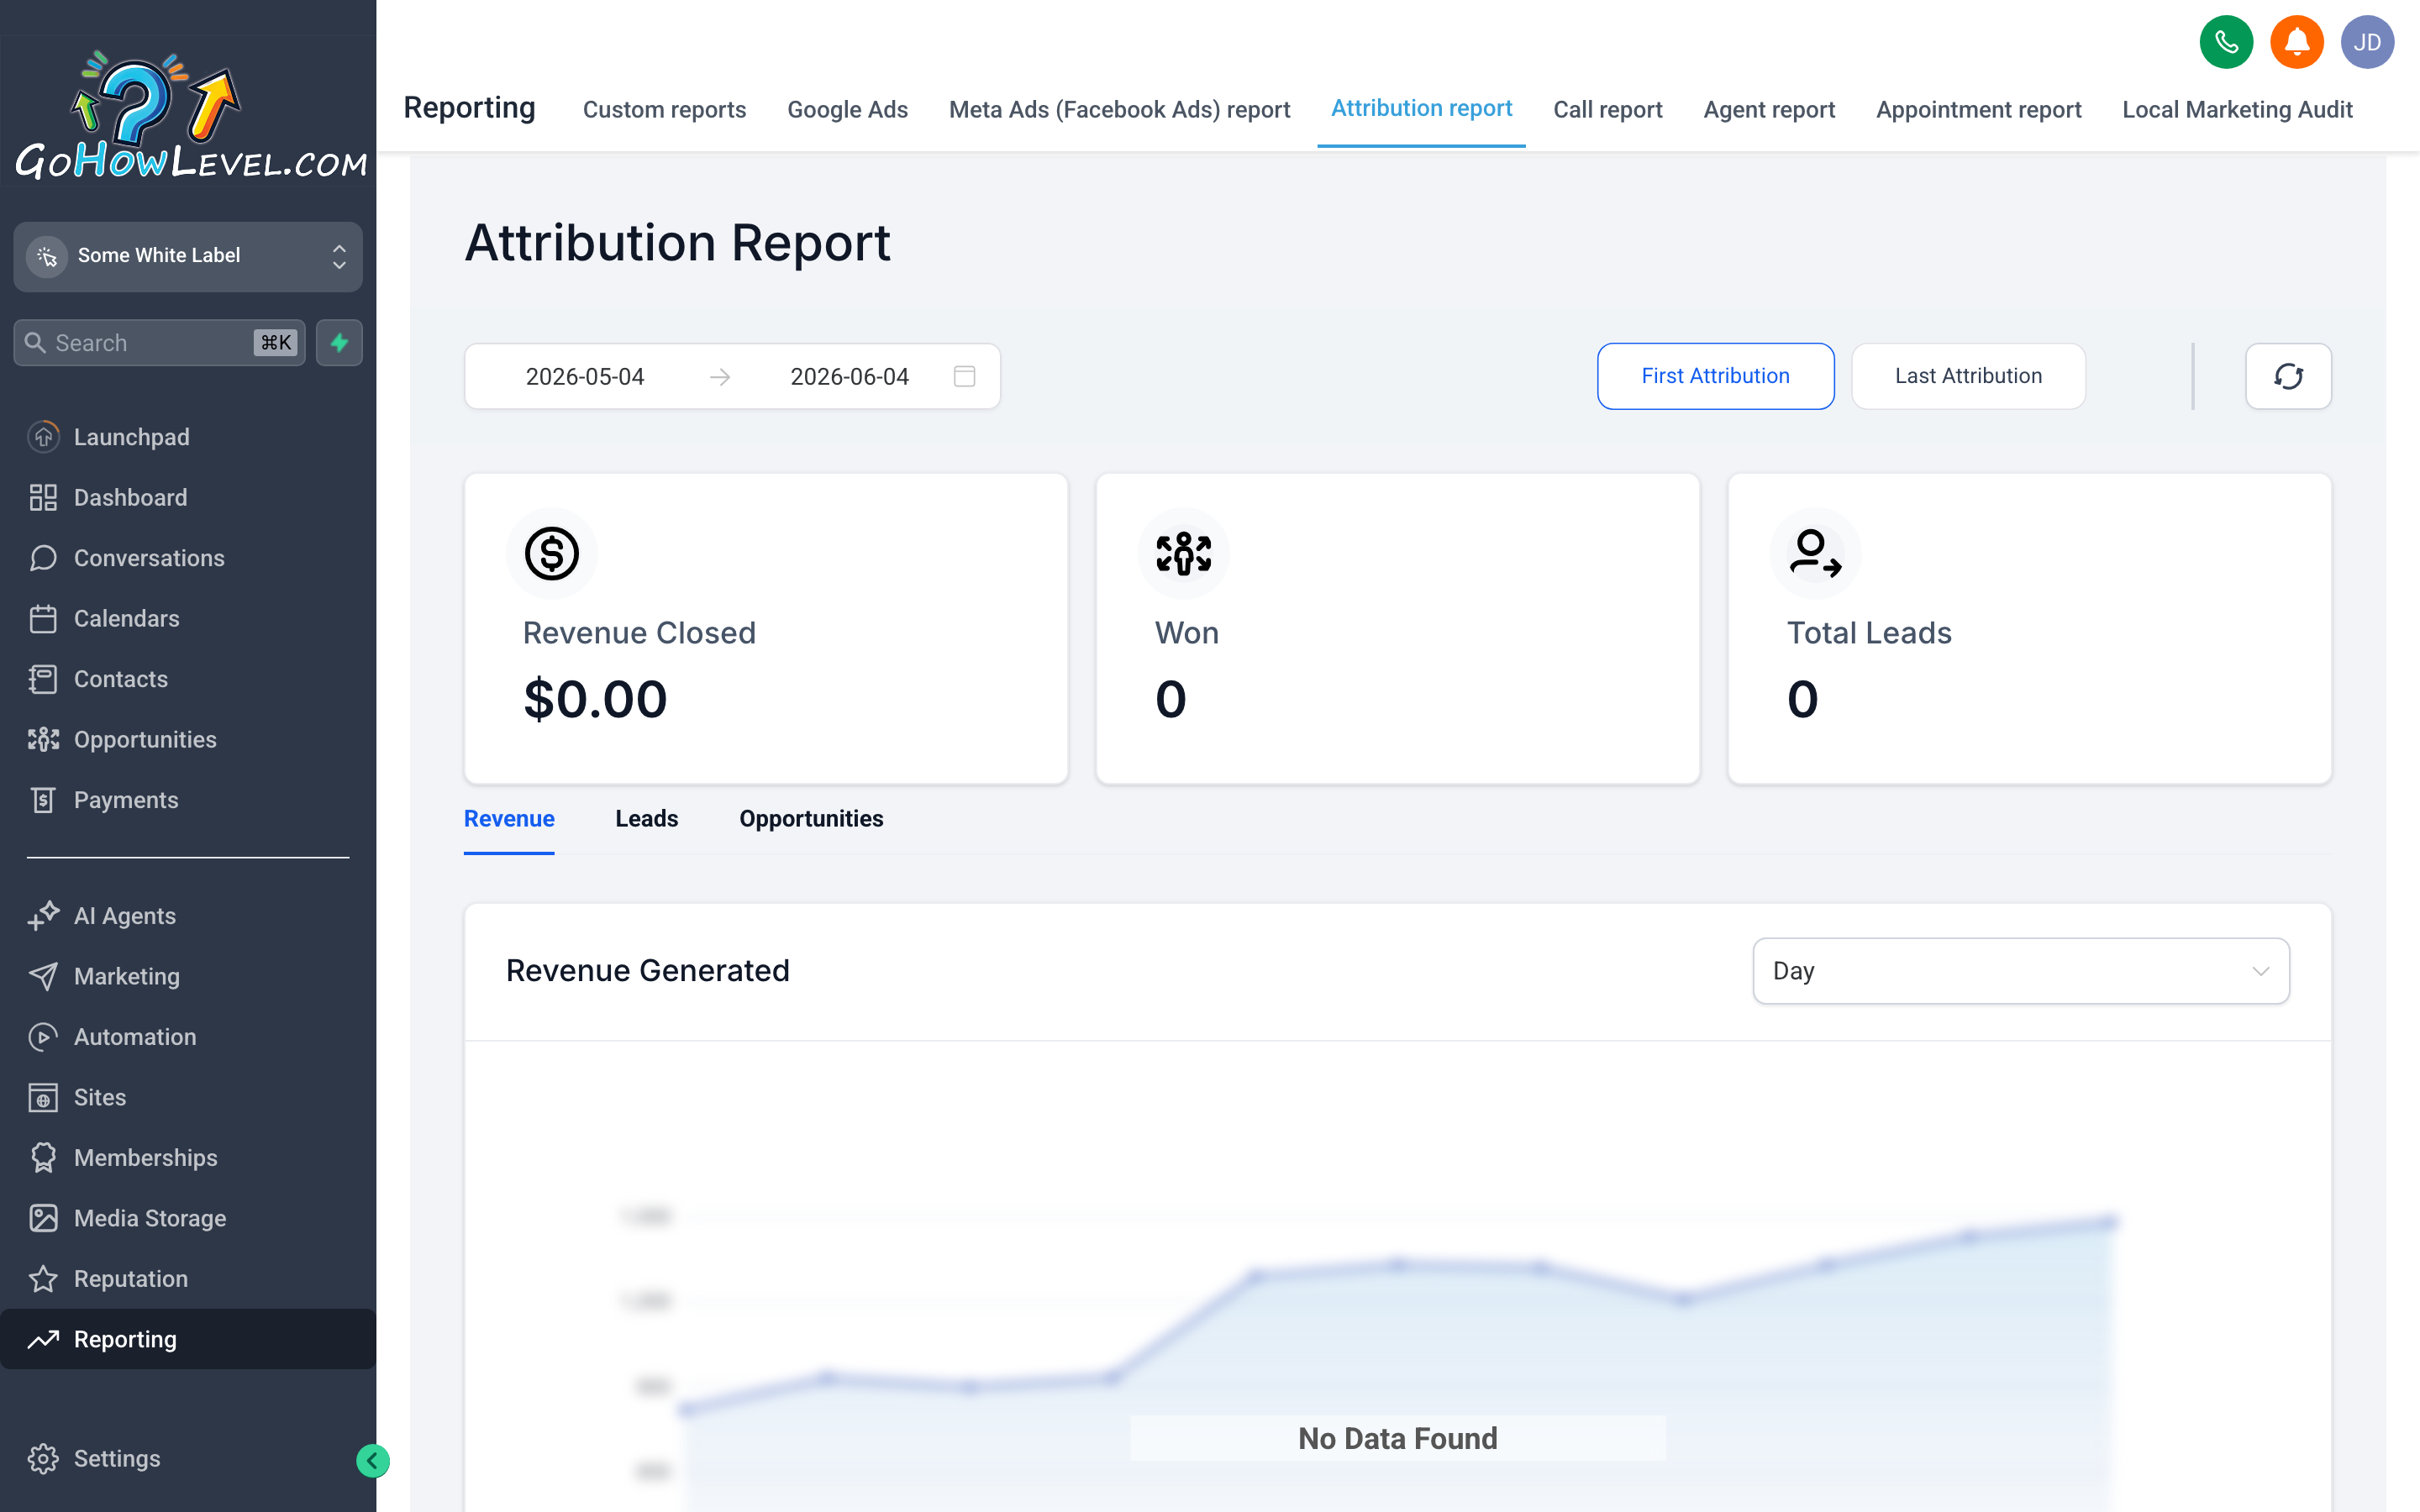
Attribution reporting answers the question every business owner eventually asks: where are our best leads actually coming from?
The Attribution report shows you which sources — organic search, paid ads, referral links, direct, social — are generating your contacts, and how much pipeline revenue those contacts represent.
What the report shows
Section titled “What the report shows”- Contacts by source — a breakdown of how many new contacts came in from each tracked source during the period.
- Pipeline revenue by source — the value of deals in your pipeline whose associated contacts came from each source.
- Conversion rate by source — what percentage of contacts from each source converted to an opportunity in your pipeline.
Attribution is based on the UTM parameters appended to your links and the source tracking your CRM captures when a contact is created.
Set up proper UTM tracking
Section titled “Set up proper UTM tracking”For attribution data to be meaningful, your ad links, social posts, and email links should include UTM parameters:
utm_source— where the traffic is coming from (e.g.,facebook,google,newsletter).utm_medium— the type of channel (e.g.,cpc,email,organic).utm_campaign— the specific campaign name.
When a contact submits a form or books an appointment, your CRM captures these values and stores them on the contact record. The Attribution report aggregates them.
How to act on attribution data
Section titled “How to act on attribution data”- Identify your highest-converting source — the one with the best ratio of pipeline revenue to contacts added. Put more resources there.
- Identify sources with high contact volume but low pipeline revenue — these may be generating unqualified leads. Review the targeting or the offer on those channels.
- Watch for direct traffic being unusually high — this often means contacts are coming in from links without UTM tags. Audit your recent campaigns for untagged links.
Call Reporting
Section titled “Call Reporting”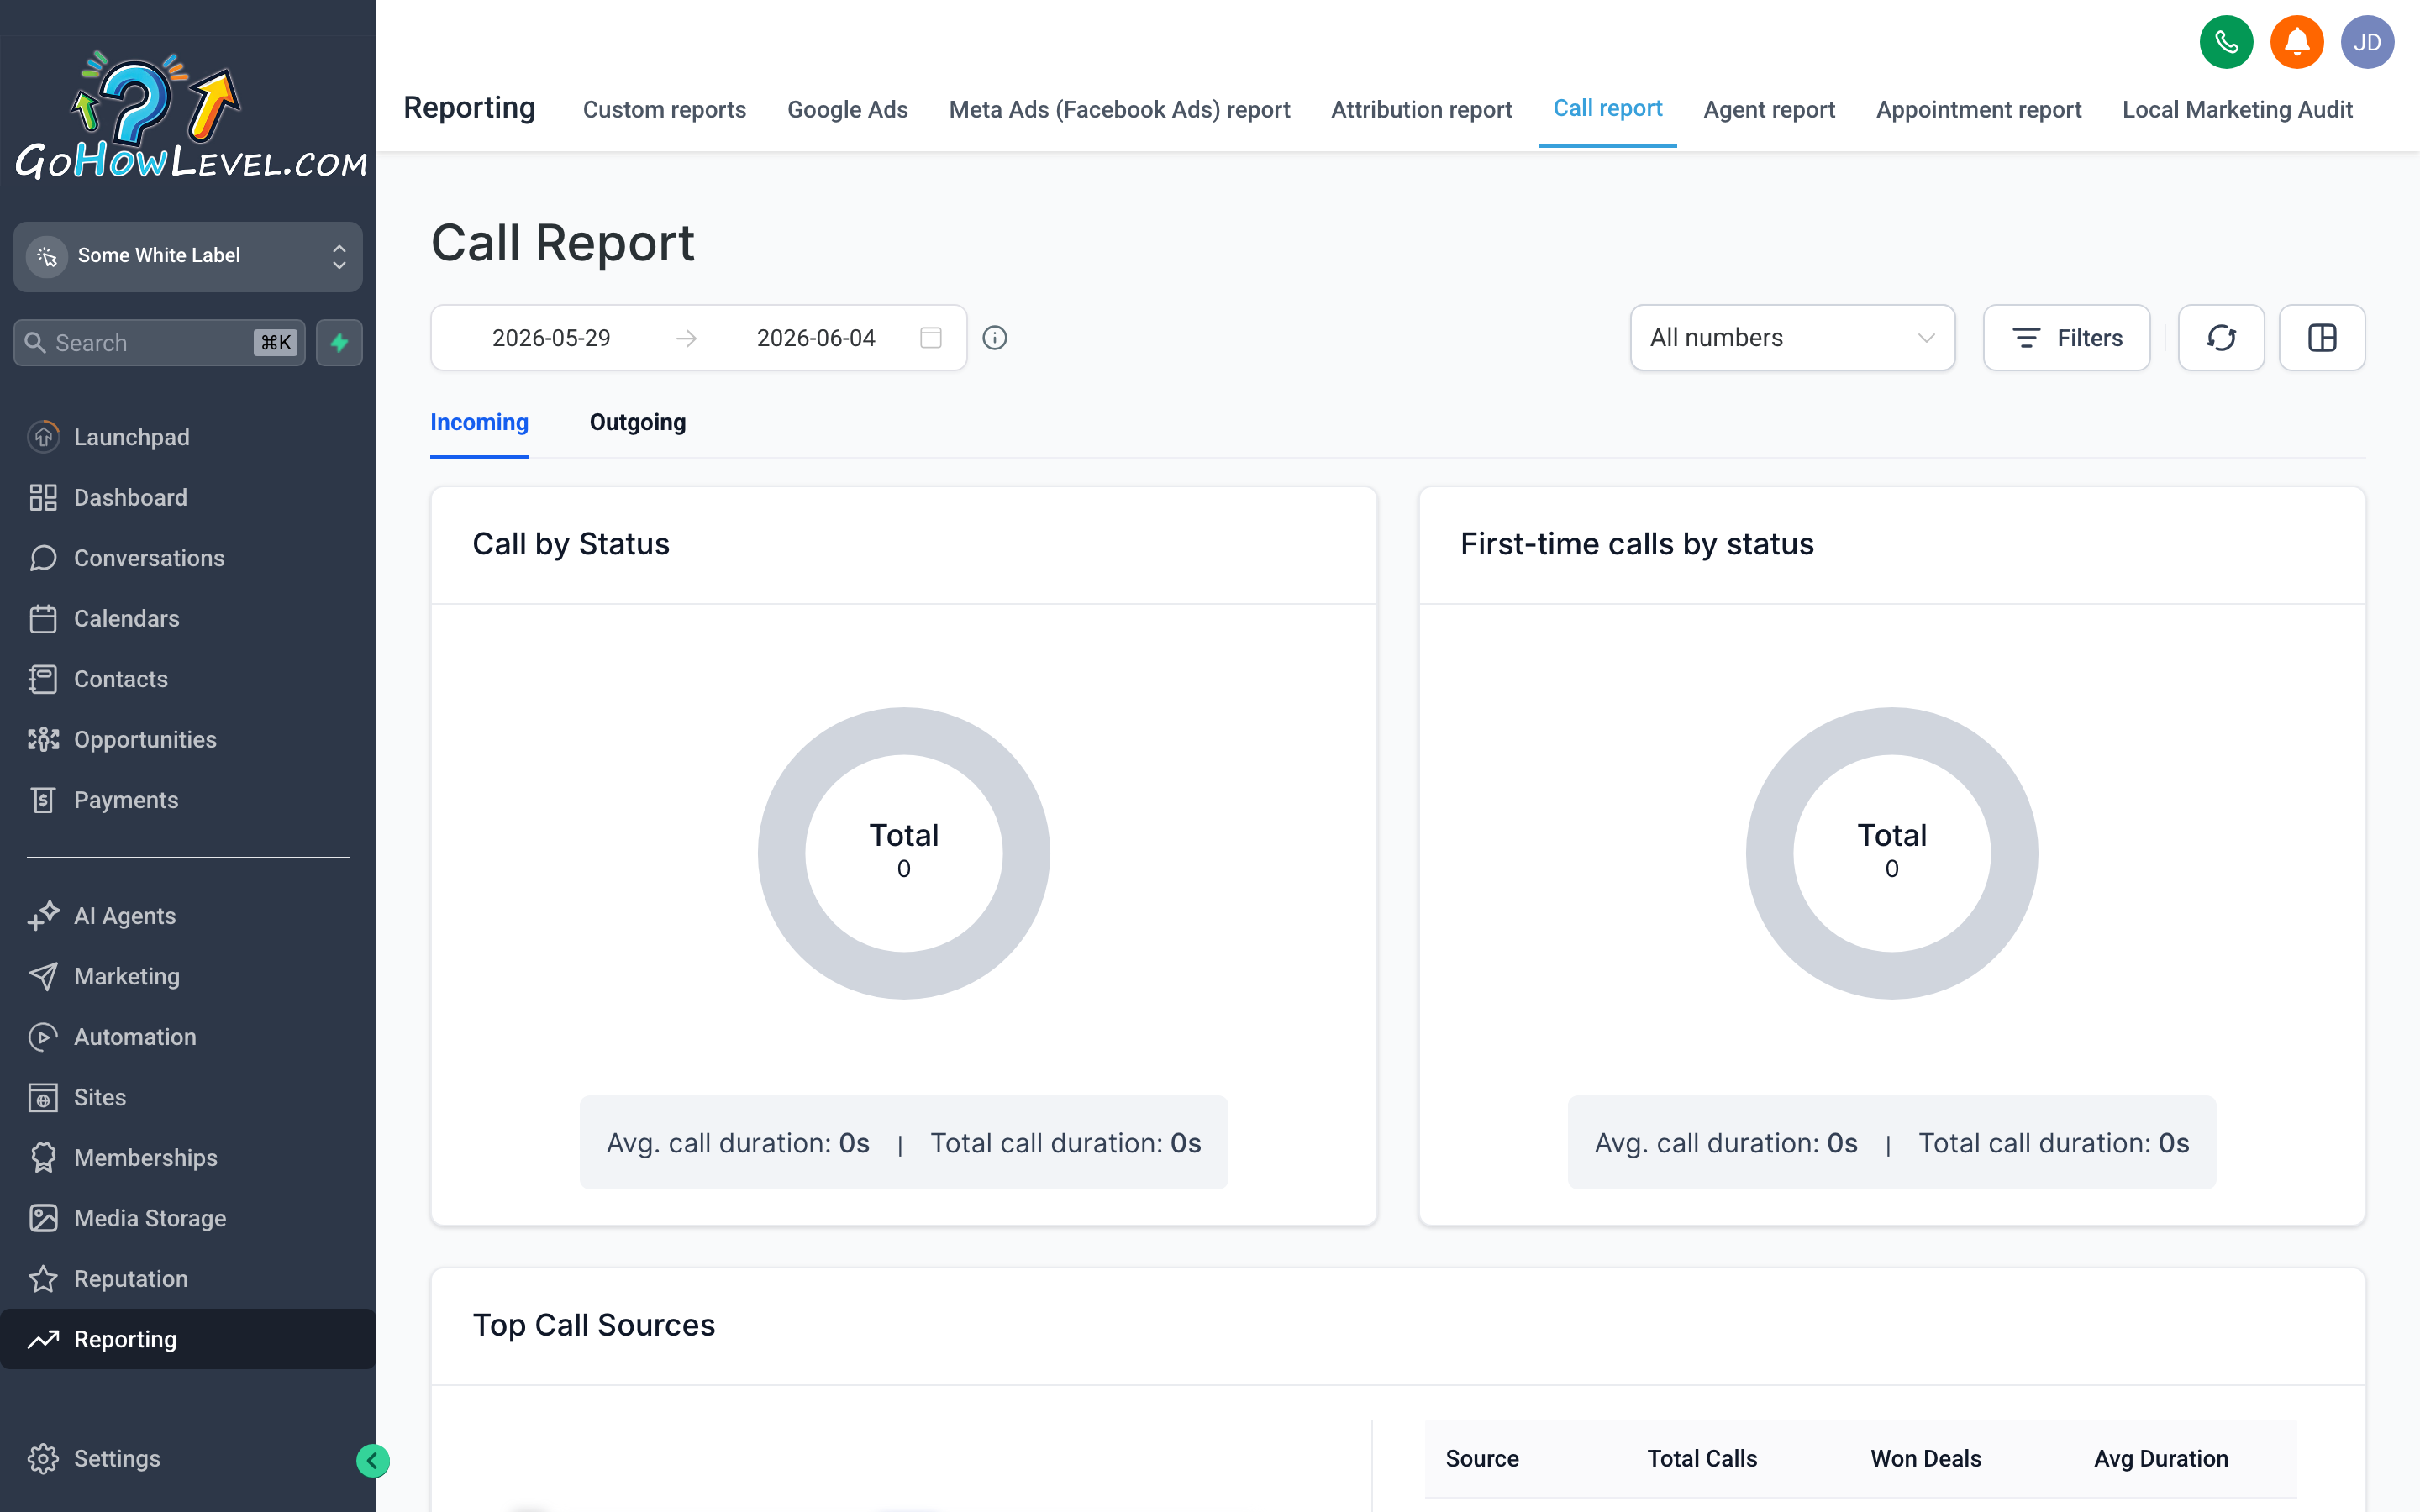
Call reporting gives you visibility into phone activity across your account — total volume, answer rates, duration, and individual call recordings all in one view.
The Call Reporting tab shows activity for calls made and received through your CRM’s phone system.
What the report shows
Section titled “What the report shows”- Total calls — inbound and outbound calls for the period.
- Answered vs. missed — how many calls connected vs. went unanswered.
- Answer rate — the percentage of incoming calls that were picked up.
- Average call duration — a proxy for conversation quality (very short calls often indicate hang-ups or wrong numbers).
- Call log — a line-by-line list of every call with the contact name, number, direction (inbound/outbound), duration, date, and a link to the recording if call recording is enabled.
How to use the call log
Section titled “How to use the call log”- Open Reporting → Call Reporting.
- Set your date range.
- Filter by Direction (inbound or outbound) to narrow your view.
- Click any call row to see its details or listen to the recording.
- Use recordings to review how calls are being handled — especially useful for onboarding new team members or diagnosing why qualified leads go quiet after a first conversation.
Call volume trends
Section titled “Call volume trends”The trend chart at the top of the Call Reporting view shows total calls over time. Look for:
- Spikes — these often correspond to a campaign launch or a specific ad running.
- Drops — an unexpected drop in inbound calls after a campaign suggests the campaign may have stopped or the tracking number may have broken.
- Day-of-week patterns — most businesses see predictable high and low days. Use this to ensure your team is fully staffed on your highest-volume days.